Tyvärr är denna sida för närvarande endast tillgänglig på engelska.

Reports & key financials
Tallink Grupp releases its financial results four times a year, after the end of each financial quarter.
Tallink Grupp
TAL1T | ISIN EE3100004466
0.0000 €
NaN (0% ↑)
Öppningskurs
0
Högsta kurs
0
Lägsta kurs
0
Volym
0
Information as of: January 01, 1970 at 00:00 AM (GMT +3)Nasdaq Tallinn
Reports
Q2
23.07.2026
Interim Report Q2
IITraffic volume
IIAugust 2026
Factsheet
23.07.2026
Webinar
IQ3
22.10.2026
Interim Report Q3
IITraffic volume
IIOctober 2026
Factsheet
22.10.2026
Webinar
IQ4
19.02.2027
Interim Report Q4
ITraffic volume
IIFebruary 2027
Factsheet
19.02.2027
Webinar
IQ1
Q2
Q3
Q1
Q2
Q3
Q1
Q2
Q3
Q1
Q2
Q3
| Event | Date |
|---|---|
| December traffic volumes | 5 January 2026 |
| January traffic volumes | 3 February 2026 |
| Unaudited 12-months interim report | 19 February 2026 |
| February traffic volumes | 3 March 2026 |
| March traffic volumes | 6 April 2026 |
| Unaudited 3-months interim report | 23 April 2026 |
| April traffic volumes | 5 May 2026 |
| May traffic volumes | 3 June 2026 |
| June traffic volumes | 3 July 2026 |
| Unaudited 6-months interim report | 23 July 2026 |
| July traffic volumes | 4 August 2026 |
| August traffic volumes | 3 September 2026 |
| September traffic volumes | 5 October 2026 |
| Unaudited 9-months interim report | 22 October 2026 |
| October traffic volumes | 3 November 2026 |
| November traffic volumes | 3 December 2026 |
Traffic volume
Financial results
| million, EUR | 2020 | 2021 | 2022 | 2023 | 2024 |
|---|---|---|---|---|---|
| Net sales | 443 | 477 | 771 | 835 | 786 |
| Gross profit/loss | -43 | 22 | 114 | 204 | 154 |
| EBITDA | 8 | 58 | 136 | 215 | 175 |
| Net profit/loss | -108 | -57 | 14 | 79 | 40 |
| Depreciation | 101 | 95 | 98 | 101 | 98 |
| Investments | 100 | 20 | 203 | 28 | 22 |
| Total assets | 1,516 | 1,586 | 1,692 | 1,555 | 1,464 |
| Total liabilities | 802 | 893 | 985 | 770 | 682 |
| Interest-bearing liabilities | 705 | 780 | 854 | 649 | 556 |
| Net debt | 677 | 652 | 739 | 607 | 538 |
| Total equity | 714 | 693 | 707 | 786 | 782 |
| Fleet value | 1,135 | 1,083 | 1,288 | 1,238 | 1,175 |
| 2020 | 2021 | 2022 | 2023 | 2024 | |
|---|---|---|---|---|---|
| Gross margin | -9.8% | 4.5% | 14.7% | 24.4% | 19.5% |
| EBITDA margin | 1.8% | 12.2% | 17.6% | 25.7% | 22.3% |
| Net margin | -24.5% | -11.9% | 1.8% | 9.4% | 5.1% |
| Return on assets (ROA) | -6.1% | -2.4% | 2.4% | 7.0% | 5.1% |
| Return on equity (ROE) | -14.1% | -8.2% | 2.1% | 10.6% | 5.2% |
| Return on capital employed (ROCE) | -2.8% | 3.1% | 8.4% | 5.7% | 6.0% |
| Equity ratio | 47% | 44% | 42% | 50.5% | 53.4% |
| Net debt / EBITDA | 84.2 | 11.2 | 5.4 | 2.8 | 3.1 |
| Number of employees as at the end of year | 4,200 | 4,785 | 4,904 | 4,912 | 4,849 |
Latest publications of AS Tallink Grupp
Frequently asked questions
- What is Tallink Grupp's financial year?What is Tallink Grupp's financial year?
Tallink Grupp’s financial year runs from 1 January to 31 December. However, prior to 2011 Tallink Grupp’s financial year started on 1 September and ended on 31 August.
- Where can I listen to Tallink Grupp’s results’ webinars?Where can I listen to Tallink Grupp’s results’ webinars?
Tallink Grupp holds quarterly webinars, which typically take place on the same day with the disclosure of quarterly results. Invitation to webinars is circulated about a week before the webinar through a stock exchange announcement. Subscription for Tallink Grupp’s stock exchange announcements can be registered.
- Who is Tallink Grupp’s independent auditor?Who is Tallink Grupp’s independent auditor?
Tallink Grupp’s independent auditor is KPMG Baltics OÜ. Please refer to Tallink Grupp’s most recent annual report for the latest independent auditor’s report.


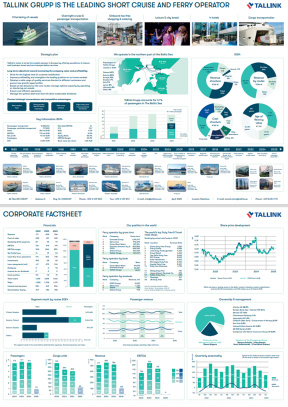
 Company Factsheet
  Company Q3 Presentation